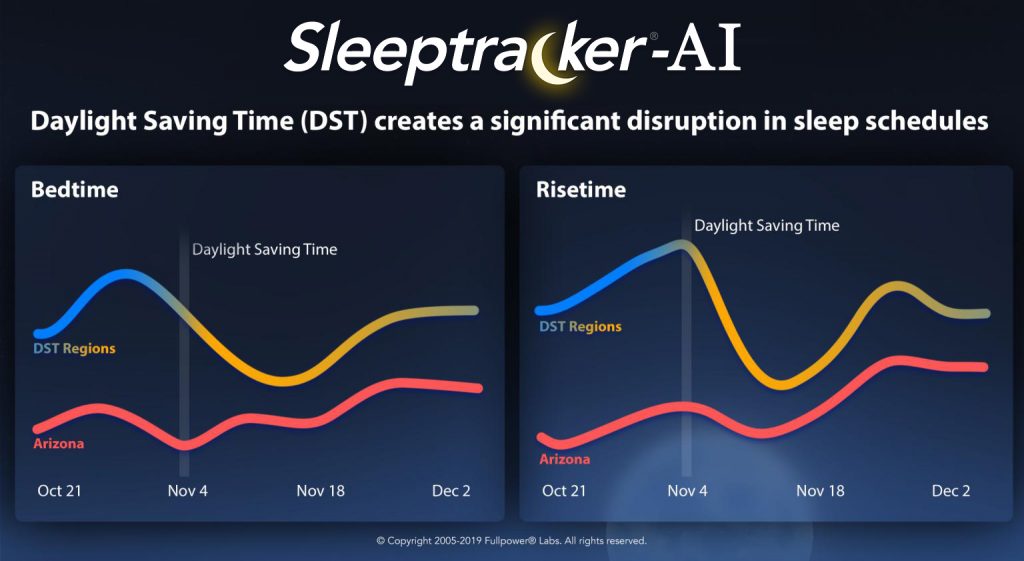
For the last four years, Sleeptracker AI data has recorded significant disruption in sleep patterns during the fall when we wind the clock back, losing an hour of daylight. In comparison, the state of Arizona does not change its time for Daylight Saving Time. As a result, their data does not show a disruption.
The following link points to a recent discussion on “CBS This Morning” regarding the potential impacts of fall sleep disruption. youtu.be/Bk8zqWKeLy0
Daylight Saving Time disrupts our sleep. Twice a year, every year. Sleep Disruption! Arizona and Hawaii get it right! The data shows that the switch back and forth to and from Summertime affects us all, night owls as much as morning larks. Both are affected in the same way, on average about three weeks of sleep pattern disruption per year.
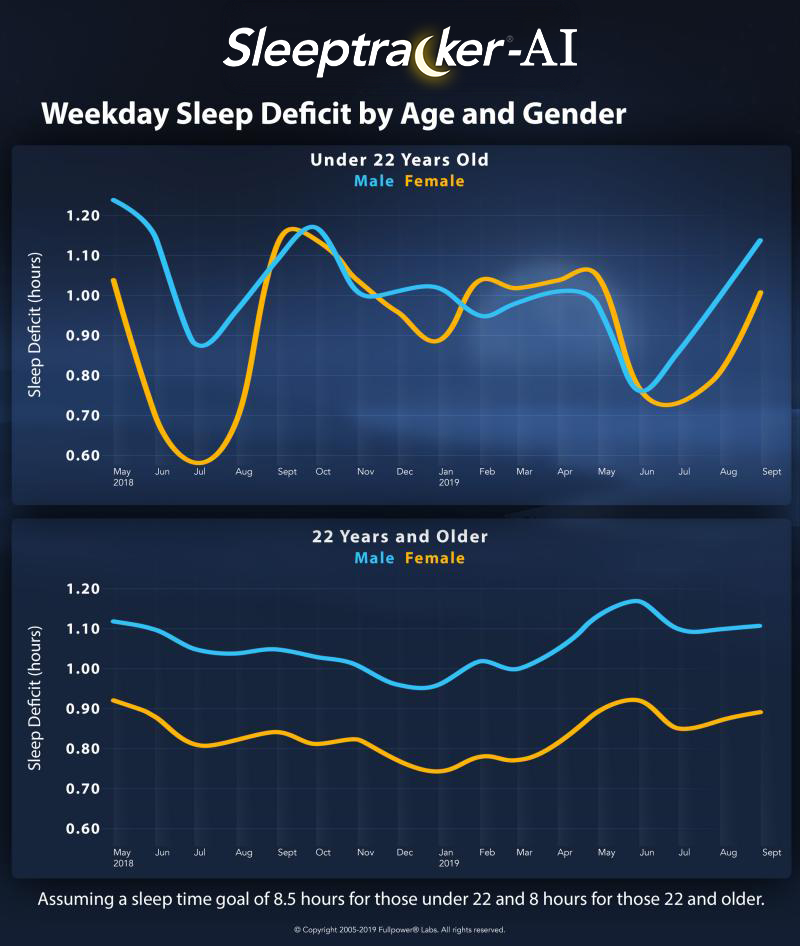
We all live in a sleep-deprived society, regardless of age. In the graphic below, we studied sleep deficits from Fullpower’s PSG-level Sleeptracker AI platform. Of course, we should all sleep longer, but the reality of modern life is that we only have so much of a “sleep budget” given the constraints of family, work, social media, etc. Therefore, a complementary focus is on the quality of sleep: Improving sleep quality for better sleep is important. For that purpose, bedding, mattress quality, respiratory environment, and temperature control are very important as some of us sleep hot (mostly males) and some of us want to be warmer. All of the above are potentially big contributors to sleep quality, or what we know as restful sleep.
Of note here, women typically average less of a sleep deficit than males.
This plot assumes a target sleep time of 8.5 hours for those under 22 and 8 hours for those above 22. In line with recommendations from the National Sleep Foundation: //www.sleepfoundation.org/articles/how-much-sleep-do-we-really-need. It’s “conservative” for those under 22 meaning you could increase it and show even more of a deficit for that age group (just shifts the y-axis labels).
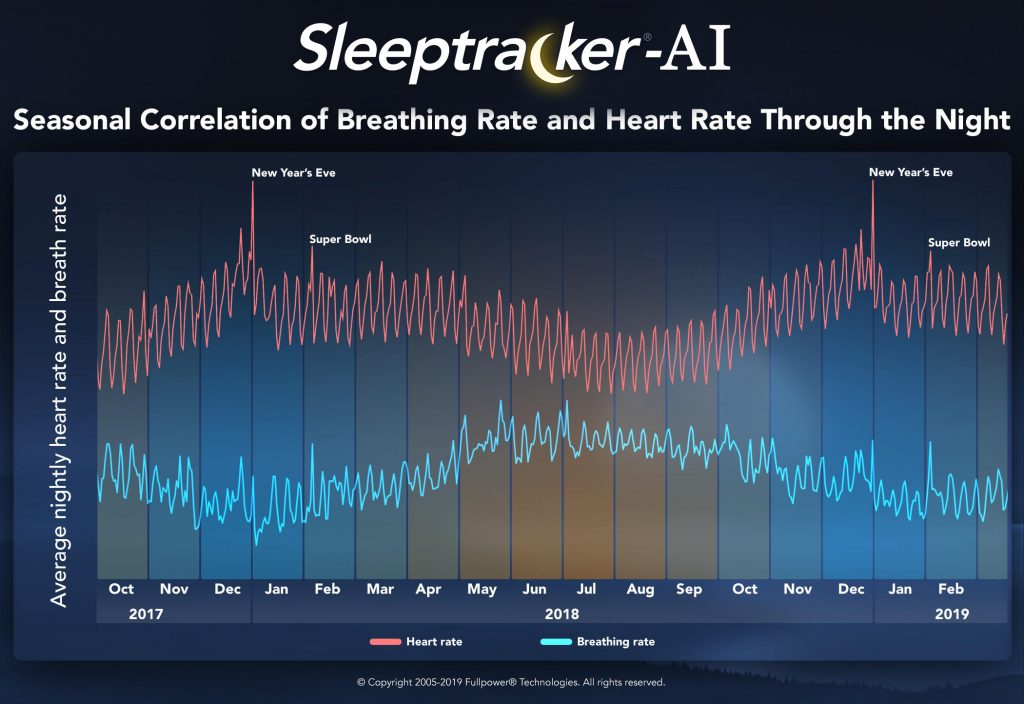
This week at Fullpower, we continue to drill down our accurate multi-year data set that comprises 250+ million nights of sleep. We now discovered previously un-identified seasonal patterns correlating continuous Breathe and heart rate over a couple of years. The Fullpower Sleeptracker platform captures continuous breath and heart rate throughout the night.
Seasonal changes occur with higher breath rates in the summer and lower in the winter. This is similar to what was observed in this independent study in Japan.
Our AI-powered analytics discovered this new correlation, and found the “inverse” breath correlations which seem to be published in this post for the first time ever as we couldn’t find this science published anywhere! Fascinating power of our long term PSG-grade datasets and tools!
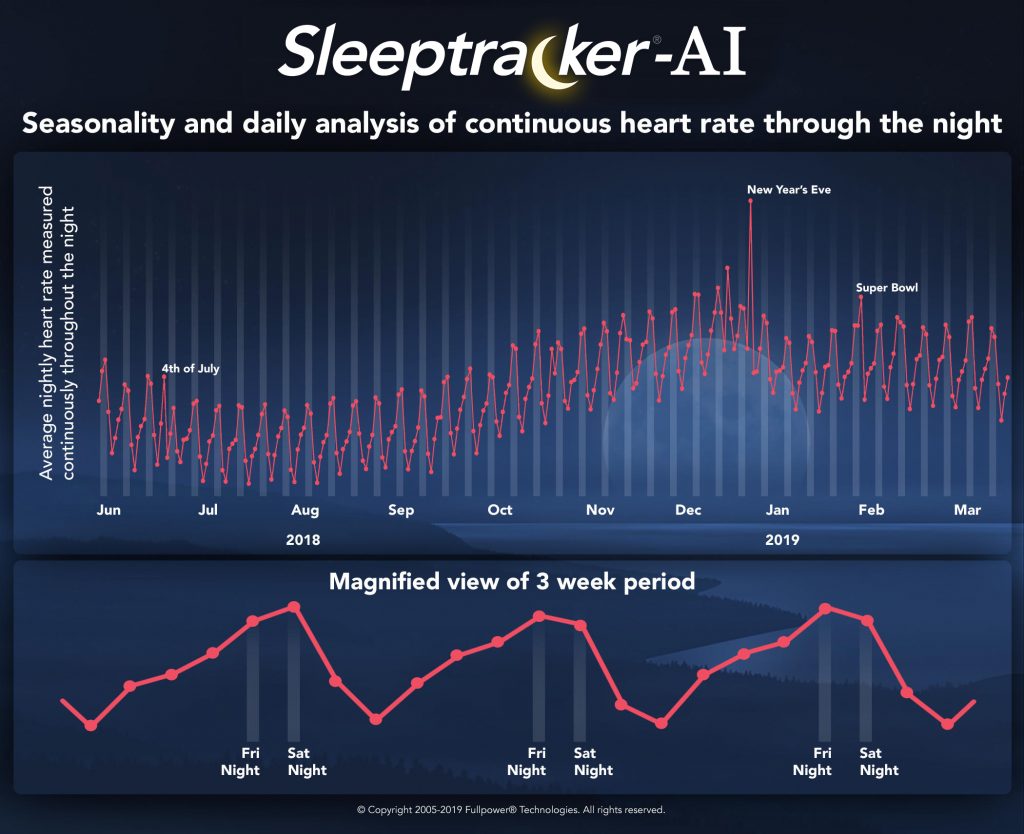
This week at Fullpower, we continue to drill down our accurate multi-year data set that comprises 250+ million nights of sleep. We found some new interesting weekly patterns within the previously identified seasonal patterns. This infographic shows weekly zoomed-in in heart rate. The Fullpower Sleeptracker platform captures continuous heart rate throughout the night.
Seasonal changes occur with lower heart rates in the summer and higher in the winter. This same pattern was also observed in this independent study in Japan. Our AI-powered analytics discovered this independently, and then we found the very interesting Japan paper https://lnkd.in/gNpi7ub .
Notice week after week, there is a consistent weekly cycle with lower heart rates early in the week leading to higher heart rates on the weekends and then recovery. Interesting.
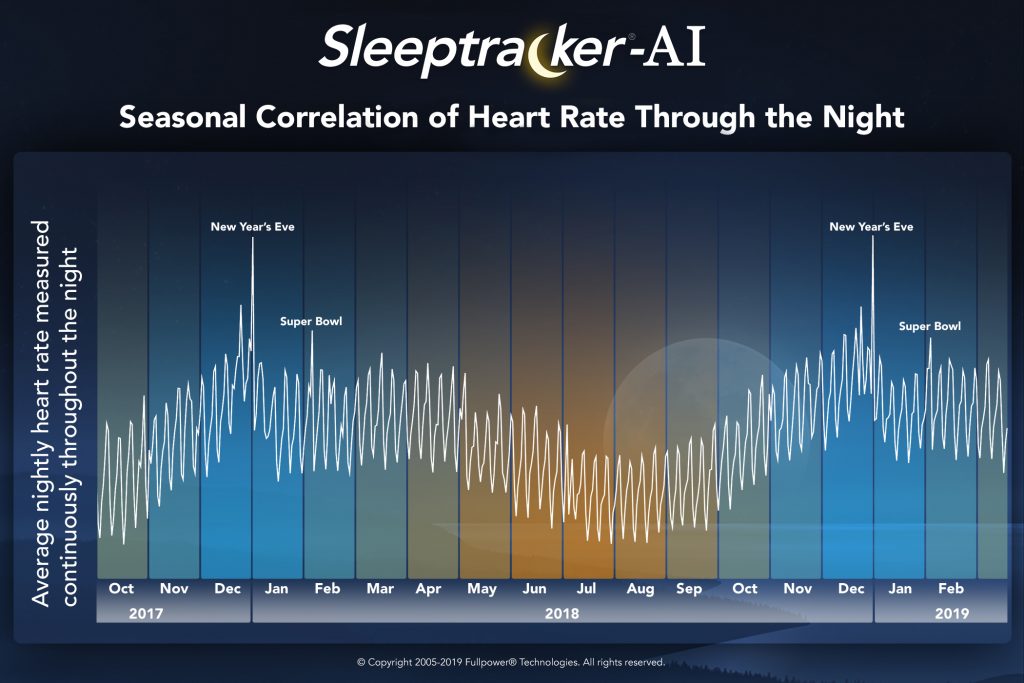
At Fullpower, we analyzed our accurate multi-year data-set that comprises 250+ million nights of sleep. We found some interesting seasonal patterns. This infographic shows seasonal changes in heart rate. The Fullpower Sleeptracker platform captures continuous heart rate throughout the night completely non-invasively. Each individual fluctuation in the graph is a weekly max and min, the max being in general weekends (bedtime and wake-time discipline are more lax on weekends) and weekdays with a more disciplined schedule and less “distractions”.
This is what we can observe:
Seasonal changes occur with lower heart rates in the summer and higher in the winter. This same pattern was also observed in this independent study in Japan. Our AI-powered analytics discovered this independently and then we found the very interesting Japan paper.
There’s a consistent weekly cycle throughout the year with lower heart rates during the week and higher on the weekends (affected by time to bed, diet, and alcohol).
We see a big spike for New Year’s eve (time to bed, diet and alcohol).
There’s a significant dip after New Year’s, perhaps due to New Year’s resolutions (better diet, decreased alcohol, more disciplined sleep schedule), but eventually, it fizzles.
There was a time not so long ago when people snapped photos and didn’t think about sharing them until much later. But these days, you might consider whether to share a pic before you’ve even taken it. Camera phones have made image transmission almost instantaneous, and it’s radically changed the way people take photographs—and perhaps even the way they live their lives.
“You are much more focused on the question of ‘OK, what do I share?'” says Clément Chéroux, curator of the new exhibit Snap+Share at the San Francisco Museum of Modern Art. “It’s not about what I’m going to take a photo of to keep as a souvenir. It’s really about what I’m going to share.”
The impulse to share images isn’t new, though. In the late 19th century, postcards detailing the sender’s location and status crisscrossed postal service routes. As photography became accessible, people subjected friends and family to slideshows; later, they hooked their digital cameras up to PCs and created new albums on Facebook. Still, the speed and scale at which we now express this impulse is unprecedented: 3.2 billion pics every day, each uploaded in a moment, many for a public audience. “It’s not only to one recipient,” Chéroux notes. “It’s to thousands.”
You can trace it all back to a photo of someone’s baby. In 1997, software developer Philippe Kahn became the first person to share a cell phone pic when he soldered cables between his Casio digital camera, Toshiba laptop, and Motorola phone to send his newborn daughter’s face to more than 2,000 people. Within three years, camera phones by Sharp, Samsung, and Sanyo were appearing on store shelves—culminating in the iPhone in 2007 and its game-changing apps the next year. Today the audience is never more than a share button away, and life all too easily devolves into a photographic performance fueled by hearts, likes, and comments.
Snap+Share is an ambitious attempt to grapple with these changes. Among the artists included in the show, Erik Kessels tries to visualize the photo glut in his work 24 HRS in Photos, which is exactly what it sounds like—staggering heaps of pictures representing a single day of all the world’s shares. David Horvitz highlights just how quickly even the most pointless of images spread in 241543903. It features memes—made in response to a call Horvitz put out through his Tumblr—of people sticking their heads into freezers, tagged with a number he made up by combining the serial number on his fridge and UPC numbers on some freezer food.
But it’s the taxidermy cat poking out of a hole in the museum’s ceiling—Eva and Franco Mattes’ Ceiling Cat—that looms the biggest. It’s based on a viral meme of a similar cat accompanied by the warning, “Ceiling Cat is watching you.” Chéroux says it’s a metaphor for surveillance: “If the cat is watching us, the internet is watching us.”
Just something to think about as you share your next pic.
Snap+Share runs March 30 through August 4 at the San Francisco Museum of Modern Art.
Read the original version of this article at Wired.com
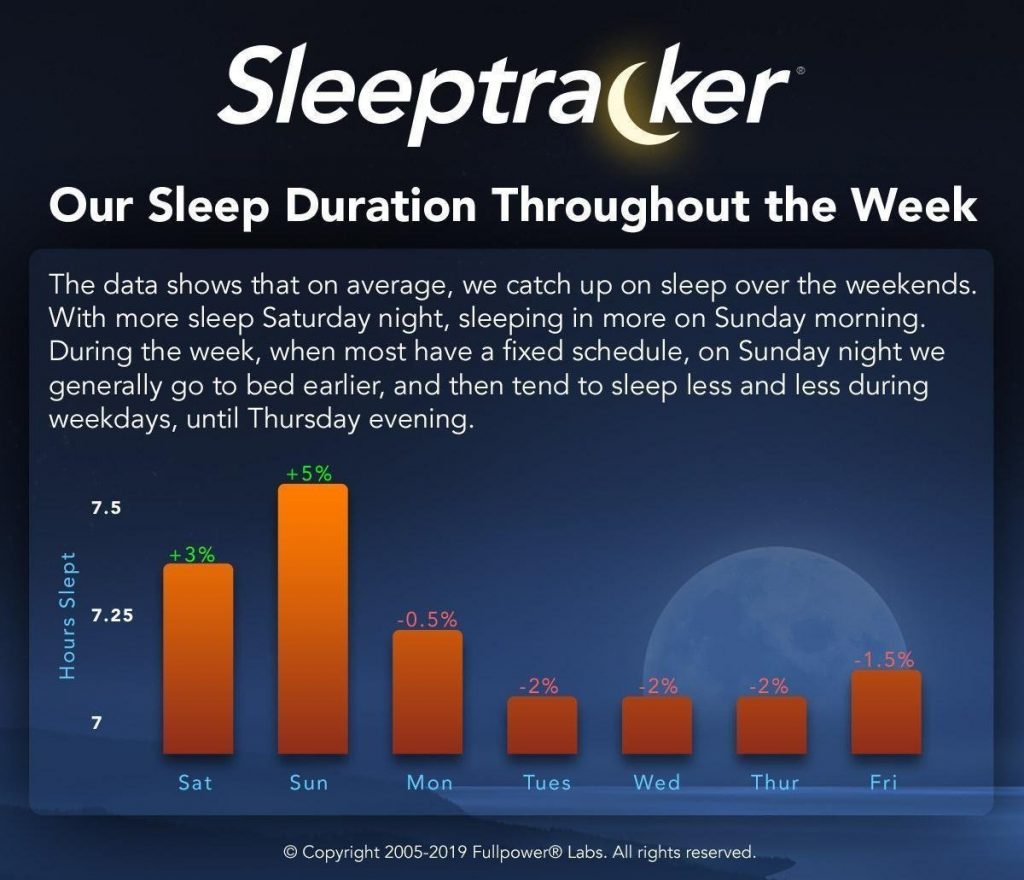
This week at Fullpower (www.fullpower.com), we’ve been thinking about how much we sleep and don’t sleep each day of the week on average; so we did some distribution analysis. Most of our Sleeptracker (www.sleeptracker.com) sleepers have regulated work schedules which bind them to a fixed weekday schedule. However, there are still several differences. And of course, many of us tend to replenish our “sleep budget” on weekends.
The following image displays the statistically meaningful weekday patterns that we represent using the Sleeptracker AI-powered predictive analytics system.
For three consecutive years, data has shown that when the US “falls back,” we are likely to see disrupted sleep for two weeks in the Spring. The disruption is a little less in the fall.
The Sleeptracker platform will be analyzing and “machine learning” anonymized big sleep data over the next few weeks with tens of thousands of sleepers every night.
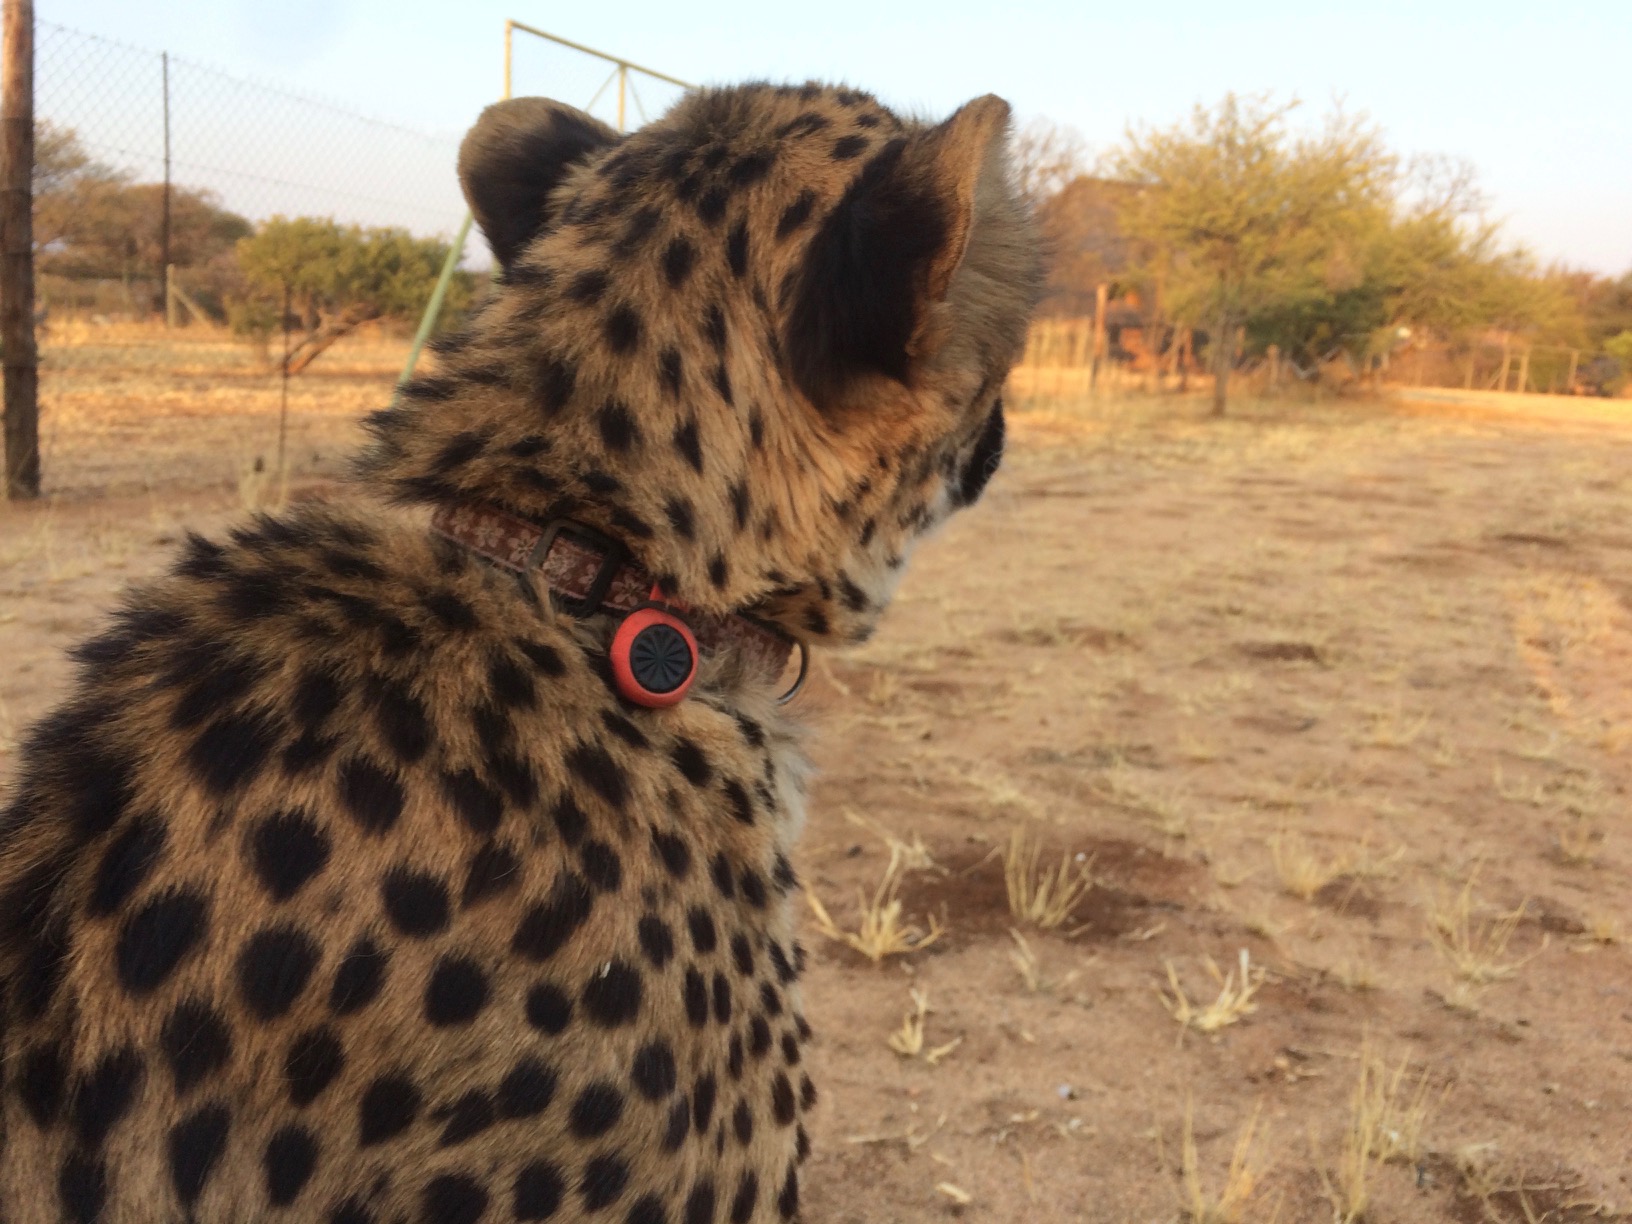
This endangered cheetah is wearing a Fullpower AI-pod for research purposes. The pod and its associated infrastructure are an AI-powered sensor-fusion edge cloud solution that learns about the Cheetah’s behavior. The AI-pod is small, waterproof, and rugged. We are in the process of learning a lot about cheetah behavior. For example: “When do Cheetahs really sleep?” or “When to Cheetahs really hunt?” This picture was taken at the Cheetah Conservation Fund based out of Namibia.
We use cookies on our website to give you the most relevant experience by remembering your preferences and repeat visits. By clicking “Accept”, you consent to the use of ALL the cookies.
This website uses cookies to improve your experience while you navigate through the website. Out of these, the cookies that are categorized as necessary are stored on your browser as they are essential for the working of basic functionalities of the website. We also use third-party cookies that help us analyze and understand how you use this website. These cookies will be stored in your browser only with your consent. You also have the option to opt-out of these cookies. But opting out of some of these cookies may affect your browsing experience.
Necessary cookies are absolutely essential for the website to function properly. These cookies ensure basic functionalities and security features of the website, anonymously.
Cookie
Duration
Description
cookielawinfo-checkbox-analytics
11 months
This cookie is set by GDPR Cookie Consent plugin. The cookie is used to store the user consent for the cookies in the category "Analytics".
cookielawinfo-checkbox-functional
11 months
The cookie is set by GDPR cookie consent to record the user consent for the cookies in the category "Functional".
cookielawinfo-checkbox-necessary
11 months
This cookie is set by GDPR Cookie Consent plugin. The cookies is used to store the user consent for the cookies in the category "Necessary".
cookielawinfo-checkbox-others
11 months
This cookie is set by GDPR Cookie Consent plugin. The cookie is used to store the user consent for the cookies in the category "Other.
cookielawinfo-checkbox-performance
11 months
This cookie is set by GDPR Cookie Consent plugin. The cookie is used to store the user consent for the cookies in the category "Performance".
viewed_cookie_policy
11 months
The cookie is set by the GDPR Cookie Consent plugin and is used to store whether or not user has consented to the use of cookies. It does not store any personal data.
Functional cookies help to perform certain functionalities like sharing the content of the website on social media platforms, collect feedbacks, and other third-party features.
Performance cookies are used to understand and analyze the key performance indexes of the website which helps in delivering a better user experience for the visitors.
Analytical cookies are used to understand how visitors interact with the website. These cookies help provide information on metrics the number of visitors, bounce rate, traffic source, etc.
Advertisement cookies are used to provide visitors with relevant ads and marketing campaigns. These cookies track visitors across websites and collect information to provide customized ads.