The Key Tool
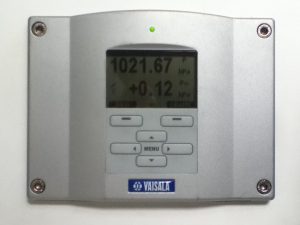
When we navigate we all have our preferences. After 13 Trans-Pacific races, 3 double-handed ones and records/victories in all the classics the tool that I would not go without for this race is a super accurate barometer. We at MotionX can’t wait for the first CE devices to have pressure sensors. There is so much we can do!
On Transpac, we’ve now developed the use of the Vaisala barometer. It’s so accurate that we absolutely sail by it. In this picture you can see that we’re running at 1021+, which would have been acceptable if the high had been like the forecasters had said: 1036+. Bu now that all the models show a slightly weaker high, we’re back at a sub-1020 target, which means South. This Vaisala unit sits right in front of our eyes. Analysis courtesy of MotionX predictive signal-processing. Enjoy. There is more to navigation than downloading weather charts and running routers. Thanks Goodness!
Running a new sheet, Hayden style
Position Update: July 11, 8:00 pm
Philippe uses MotionX-GPS HD on the iPad and is sharing with you the following track:
| Name: | Transpacific 2011-3 | |
| Start Date: | July 8, 2011 1:33 pm | |
| Map: | View on Map | |
| Total Distance: | 976.8 miles | |
| Elapsed Time: | 79:20:50 | |
| Avg Speed: | 12.3 kts | |
| Max Speed: | 20.5 kts | |
| Avg Pace: | 04’52” per nm | |
| Min Altitude: | 0 ft | |
| Max Altitude: | 0 ft | |
| Start Time: | 2011-07-08T20:33:46Z | |
| Start Location: | ||
| Latitude: | 33º 38′ 19″ N | |
| Longitude: | 118º 22′ 07″ W | |
| End Location: | ||
| Latitude: | 26º 54′ 20″ N | |
| Longitude: | 134º 44′ 12″ W | |
View from the top
In the trade-winds, day three
0600 PDT
Position is: 27 25 N, 131 37 W
TWD 035 @ 15, Swell 1 m from NW, Sky 100% cover, 1020mb
Pegasus-MotionX kite up!
Reaching with the big spinnaker
<iframe width=”560″ height=”349″ src=”http://www.youtube.com/embed/-3RL_Dxjq3k” frameborder=”0″ allowfullscreen></iframe>
Position Update: July 10, 6:00 pm
Philippe uses MotionX-GPS HD on the iPad and is sharing with you the following track:
| Name: | Transpacific 2011-2 | |
| Date: | July 8, 2011 1:33 pm | |
| Map: | View on Map | |
| Distance: | 653.8 miles | |
| Elapsed Time: | 52:20:24 | |
| Avg Speed: | 12.5 kts | |
| Max Speed: | 20.5 kts | |
| Avg Pace: | 04’48” per nm | |
| Min Altitude: | 0 ft | |
| Max Altitude: | 0 ft | |
| Start Time: | 2011-07-08T20:33:46Z | |
| Start Location: | ||
| Latitude: | 33º 38′ 19″ N | |
| Longitude: | 118º 22′ 07″ W | |
| End Location: | ||
| Latitude: | 28º 08′ 23″ N | |
| Longitude: | 128º 58′ 48″ W | |

